
Das RE.DOCTOR-Handbuch zu Vitalparametern: Ein Leitfaden zu Gesundheitskennzahlen
1. Einführung in Vitalparameter und Fernüberwachung
In den klinischen Gesundheitswissenschaften, Vitalparameter sind die wichtigsten Messwerte für die grundlegendsten Körperfunktionen. Sie liefern eine grundlegende Einschätzung des physiologischen Zustands einer Person und geben entscheidende Aufschlüsse darüber, wie effektiv Herz, Lunge und Stoffwechsel funktionieren.
Bisher waren zur Erfassung dieser Messwerte invasive Blutentnahmen oder sperrige Diagnosegeräte erforderlich. Der aktuelle Stand der Technik im Bereich der Gesundheitsüberwachung hat sich jedoch hin zu nicht-invasiven Messverfahren verschoben, bei denen Photoplethysmographie (PPG). Mithilfe einer Smartphone-Kamera oder spezieller Sensoren zur Analyse der Lichtabsorption durch die Haut nutzt das RE.DOCTOR SDK fortschrittliche KI, um komplexe Biomarker mit klinischer Präzision zu ermitteln.
Die klinische Validität dieser Technologie wird durch aussagekräftige Daten untermauert: Das RE.DOCTOR-System weist eine 72–93% Vorhersagequote über den gesamten Parameterbereich hinweg. Konkret erreicht die Technologie einen bemerkenswert niedrigen Mittlerer absoluter Fehler (MAE)—mit einer Länge von gerade einmal 2,46 Schläge pro Minute (bpm) für die Herzfrequenz, 2,62 Atemzüge pro Minute (brpm), Und 13,9 mg/dL Blutzucker—was beweist, dass softwarebasierte Überwachung mit herkömmlicher Hardware mithalten kann.
Der Übergang zu einer nicht-invasiven, softwarebasierten Überwachung stellt einen Paradigmenwechsel in Bezug auf die Autonomie der Patienten dar. Im Gegensatz zu herkömmlichen klinischen Umgebungen ermöglicht diese Technologie eine Überwachung unter “Alltagsbedingungen”. Dadurch können Rückfälle oder Stoffwechselveränderungen (wie beispielsweise Blutzuckerspitzen) frühzeitig und in Echtzeit erkannt werden, wodurch sich das Gesundheitsmodell von reaktiven Arztbesuchen hin zu einem proaktiven, kontinuierlichen Gesundheitsmanagement verlagert.
Wenn wir diese Messgrößen beherrschen, können wir die inneren Reaktionen des Körpers besser verstehen, angefangen beim grundlegendsten biologischen Prozess: der Atmung.
——————————————————————————–
2. Sauerstoffversorgung und Atmung: Der Atem des Lebens
Sauerstoffversorgung und Atmung sind die beiden Säulen des Stoffwechsels. Die eine misst den im Blut vorhandenen “Treibstoff” (Sauerstoff), während die andere die Häufigkeit der mechanischen Arbeit (Atmung) misst, die erforderlich ist, um diese Versorgung aufrechtzuerhalten.
- Blutsauerstoffsättigung (SpO2): Ein Maß für die Sauerstoffsättigung, das den prozentualen Anteil des an Sauerstoff gebundenen Hämoglobins im Verhältnis zum gesamten verfügbaren Hämoglobin angibt.
- Atemfrequenz (Resp): Die Anzahl der Atemzüge pro Minute im Ruhezustand.
|
Bezeichnung der Kennzahl |
Definition |
Normalbereich (gesunde Erwachsene) |
Die “Warnzone” |
|
Blutsauerstoffsättigung (SpO2) |
Prozentualer Anteil an sauerstoffgebundenem Hämoglobin. |
95% – 100% |
Unter 94% – 90% (klinischer Verdacht)* |
|
Atemfrequenz (Resp) |
Anzahl der Atemzüge pro Minute (brpm). |
12 – 18 brpm |
Unter 12 oder über 25 brpm |
*Hinweis: Das SDK kann zwar Werte bis hinunter zu 80% erfassen, klinische Warnwerte für den Gesundheitszustand setzen jedoch in der Regel erst ein, wenn die Sättigung unter 94% fällt.
Die Biologie des Atems: Im Inneren der roten Blutkörperchen befindet sich ein Protein namens Hämoglobin fungiert als Transportmittel. Jedes Hämoglobinmolekül kann bis zu vier Sauerstoffmoleküle transportieren. Der SpO2-Wert gibt an, wie “gesättigt” diese Transportmittel sind. Dieser Sauerstoff wird anschließend zum Herzen transportiert, um von dort aus durch den Körper gepumpt zu werden.
——————————————————————————–
3. Herzrhythmus und Herzrhythmusvariabilität: Messung der Herzleistung
Bei der Herzüberwachung werden sowohl die Pulsfrequenz als auch die feinen zeitlichen Unterschiede zwischen den einzelnen Herzschlägen analysiert.
- Herzfrequenz (HF): Gemessen in Schlägen pro Minute (bpm), das ist die Frequenz, mit der das Herz Blut pumpt.
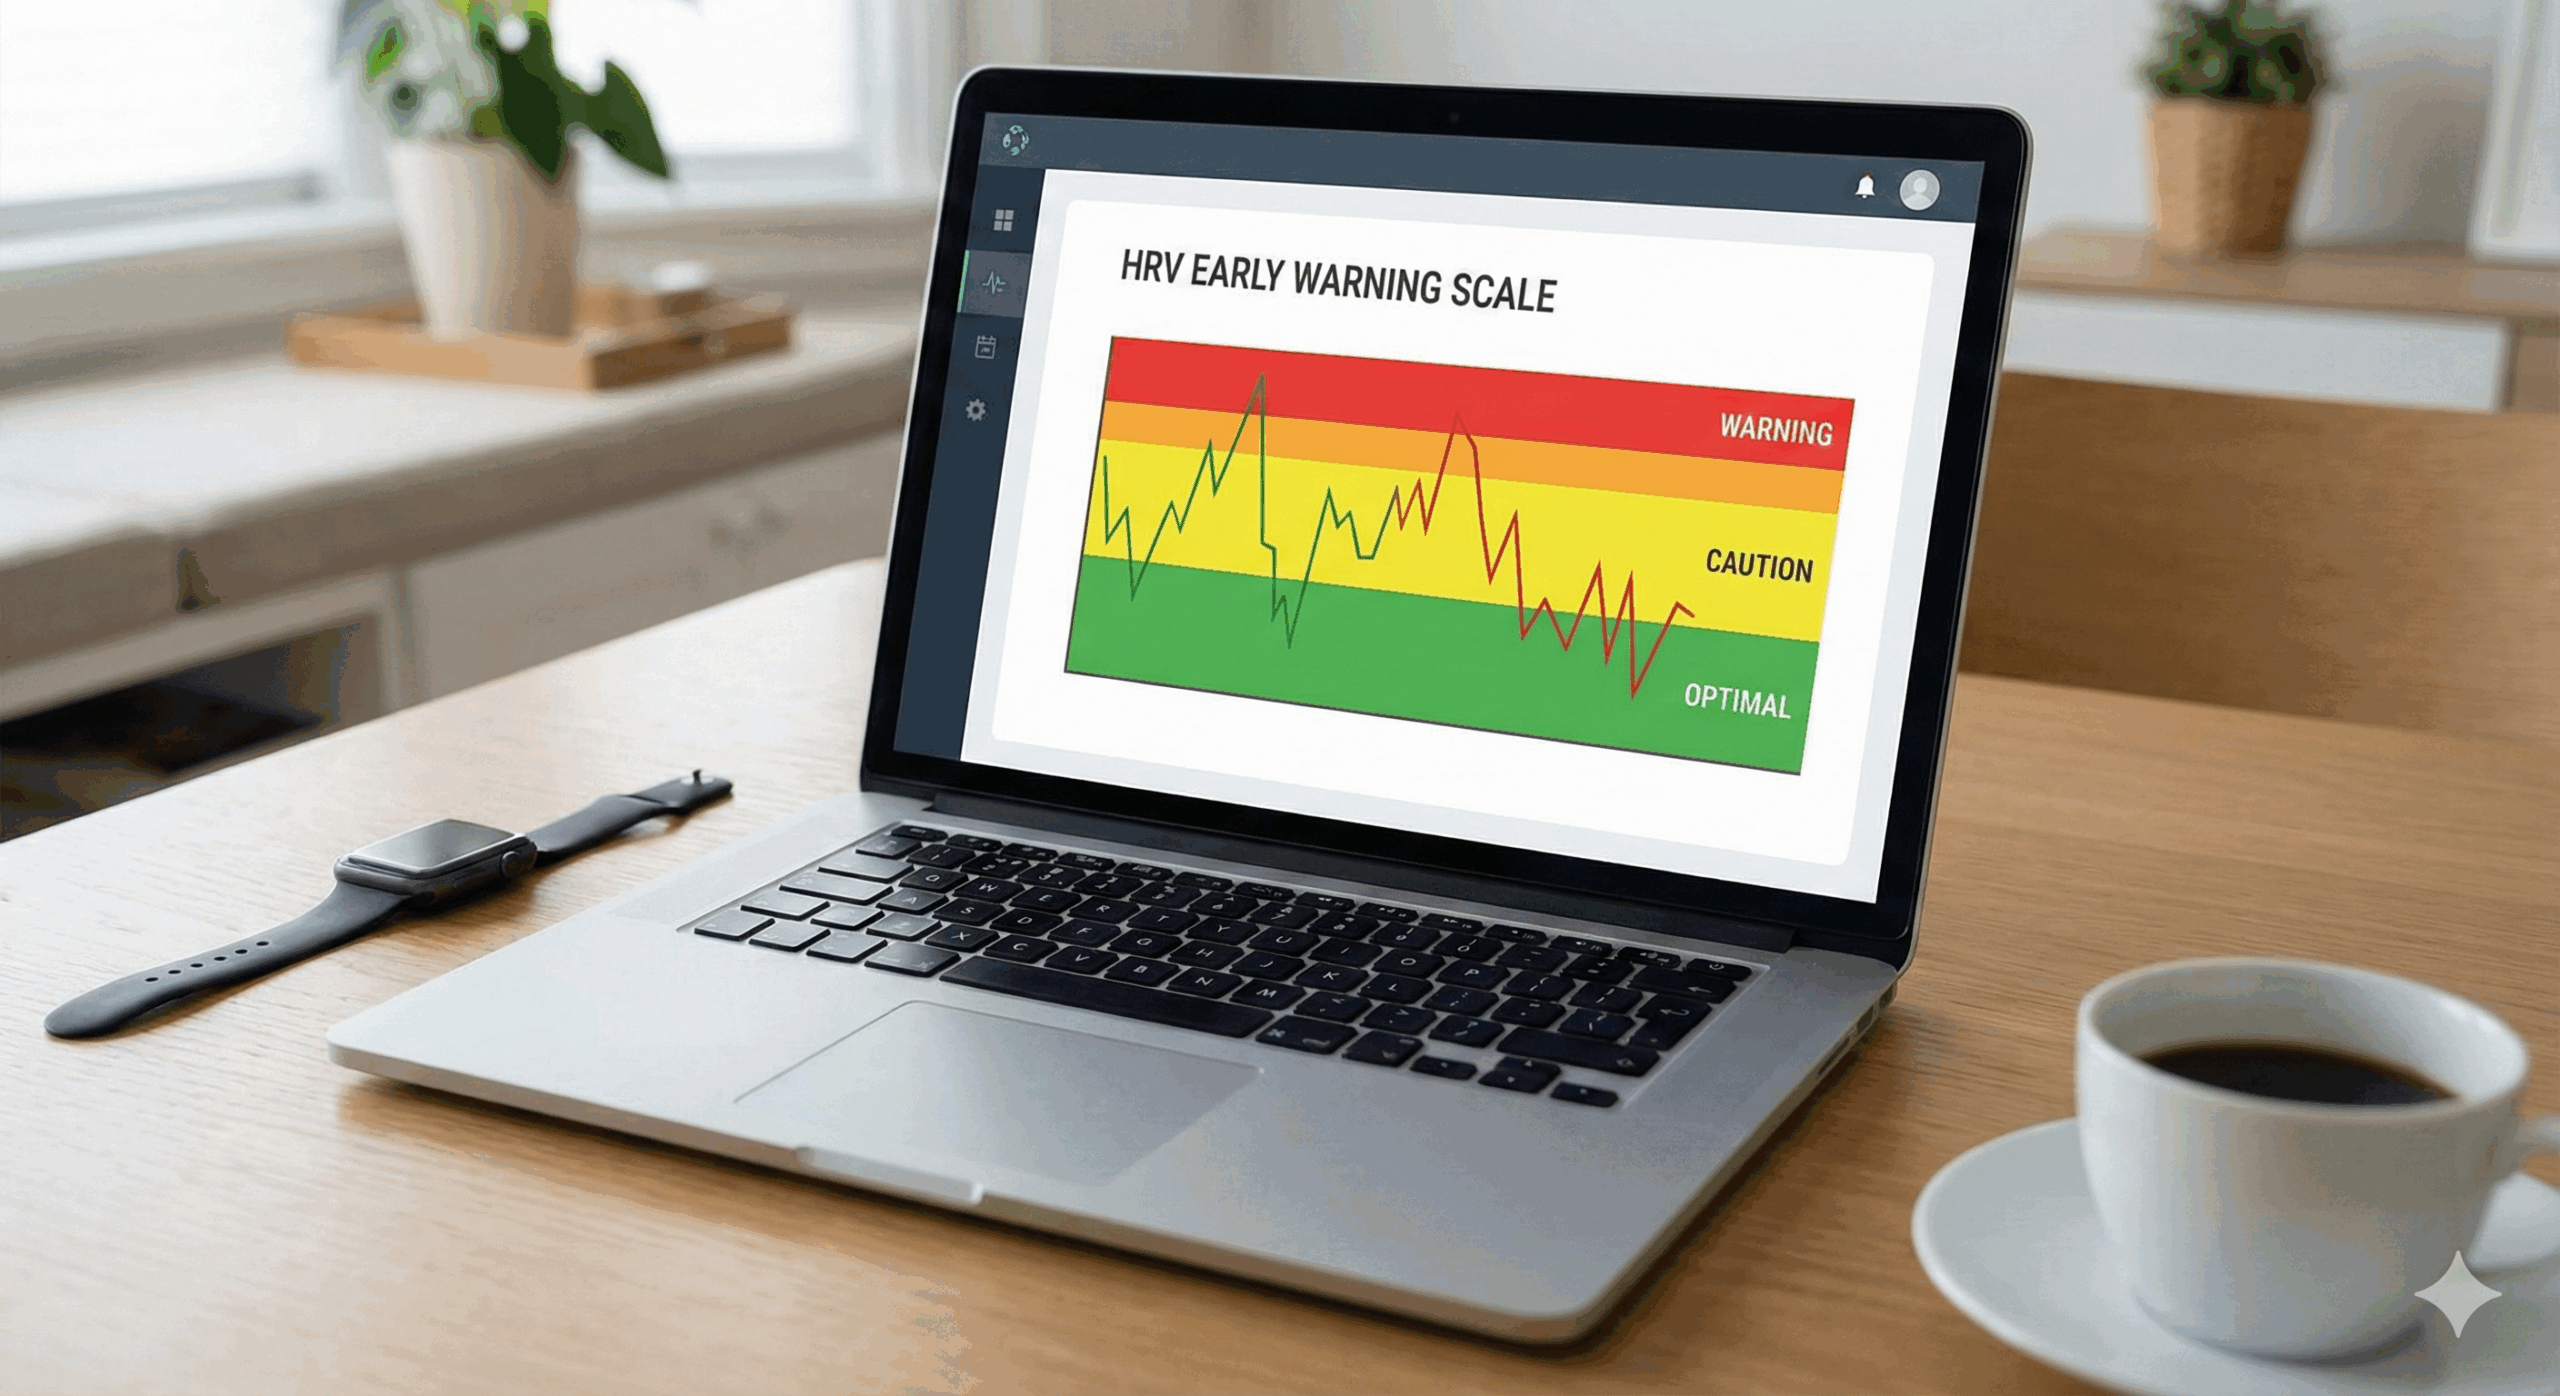
- Herzfrequenzvariabilität (HRV): Gemessen in Millisekunden (ms), this represents the variation in time intervals between adjacent heartbeats.
Rhythm vs. Frequency: While HR tracks speed, HRV tracks the balance of the Autonomic Nervous System (ANS).
- “Fight-or-Flight” State: When the sympathetic nervous system is dominant due to stress, the variation between beats is lower.
- Relaxed State: When the parasympathetic nervous system is dominant (resting and recovering), the variation is typically higher.
HRV and the Aging Process: HRV naturally declines as the heart and nervous system age. The following data illustrates typical ranges for healthy populations:
|
Age Group |
Typical HRV Range (ms) |
|
20–25 years old |
55 – 105 ms |
|
60–65 years old |
25 – 45 ms |
The Autonomic Nervous System simultaneously influences heart rhythm and the tension in your blood vessels, leading directly to the study of hemodynamics.
——————————————————————————–
4. Hemodynamics: Understanding Blood Pressure Dynamics
Blood pressure measures the force of blood against arterial walls. It is defined by two primary figures and the resulting difference between them.
- Systolic Blood Pressure (BPS): The pressure in the arteries when the heart beats.
- Diastolic Blood Pressure (BPD): The pressure in the arteries when the heart muscle rests between beats.
- Pulse Pressure (PP): The numeric difference between the two (PP = Systolic – Diastolic).
Clinical Implications of Pulse Pressure:
- Normal: Approximately 40 mmHg. This indicates a healthy balance in the circulatory system.
- Wide / High: 50 mmHg or higher (and >60 mmHg in older adults). This increases the risk of heart disease, stroke, and rhythm disorders. In diabetic patients, wide pulse pressure is a high-value indicator of potential kidney or eye damage.
- Narrow / Low: One-fourth or less of the systolic pressure. This suggests the heart is not pumping effectively, often seen in heart failure, valve disease, or internal bleeding.
As pressure changes, it reflects the physical state and flexibility of the arteries themselves.
——————————————————————————–
5. Advanced Vascular Health: Stiffness and Reflection
Beyond pressure, we can measure the physical “compliance” and condition of the blood vessels through two specific indices.
- Reflection Index (RI): A measure of the percentage of the pressure wave reflected back from the narrowing of the small arteries.
- Large Arterial Stiffness Index (LASI/SI): An indicator of the speed at which a pulse wave travels, identifying the stiffness of the large arteries.
The “Pebble in a Puddle” Analogy: Imagine throwing a pebble into a puddle. Waves ripple out to the edges and reflect back toward the center, but with less energy. In the body, RI measures the wave reflecting back from the small arteries. High reflection energy (higher RI) correlates to the narrowing or poor condition of the small arteries. Individuals with Left Ventricular Hypertrophy (LVH) often show higher RI values (averaging 80%).
Formulas and Units:
- RI Formula: RI = frac{a}{b} times 100% (where a is the diastolic peak height and b is the total amplitude).
- SI Formula: SI = frac{text{Subject Height}}{Delta T_{DVP}} (where Delta T_{DVP} is the peak-to-peak time of the reflected wave).
- Units: RI is expressed as a % or scale of 0–1; SI is measured in m/s.
Vascular health measurements are a “snapshot” influenced by diet, exercise, and caffeine. To establish a reliable health profile, regular periodic testing is required rather than relying on a single measurement.
——————————————————————————–
6. Metabolic Health: Blood Glucose and Glycemia
Blood glucose (BG) is the concentration of sugar in the blood. Monitoring these levels is vital for the early detection of metabolic disorders.
|
Category |
Fasting Blood Glucose Range (mg/dL) |
Clinical Implications |
|
Hypoglycemia |
Below 70 mg/dL |
Risk of dizziness/palpitations; needs immediate attention. |
|
Normal |
70 – 100 mg/dL |
Target range for healthy function. |
|
Prediabetes |
100 – 125 mg/dL |
Increased risk for Type 2 Diabetes; lifestyle changes urged. |
|
Diabetes |
126 mg/dL or higher |
Diagnosed if found on two separate tests. |
Hypoglycemia Awareness: If blood sugar drops too low, a student or patient may experience:
- Dizziness and blurred vision
- Excessive sweating
- Heart palpitations
The Autonomic Nervous System acts as a bridge between these biochemical markers and the body’s overall state of tension.
——————————————————————————–
7. Systemic Tension: The Stress Metric
The RE.DOCTOR SDK provides a quantitative metric for systemic tension, referred to as Stress.
“Stress is a physical, mental or emotional factor that causes bodily or mental tension. It is generally recognized as one of the major factors leading to a spectrum of health problems.”
Stress is classified on a 1–100 scale:
- 0–30: Low Stress
- 30–70: Medium Stress
- 70–100: High Stress
The “So What?”: High systemic tension is a clinical concern because it can exacerbate hypertension, cause heart rhythm imbalances, and disrupt metabolic health.
——————————————————————————–
8. Summary Table of Units and SDK Ranges
|
Parameter Name |
Abbreviation |
Unit of Measurement |
SDK Estimated Range |
|
Blood Oxygen |
SpO2 |
% |
80 – 100 |
|
Heart Rate |
HR |
bpm |
40 – 200 |
|
Atemfrequenz |
Resp |
brpm |
6 – 36 |
|
Systolic BP |
BPS |
mmHg |
75 – 140 |
|
Diastolic BP |
BPD |
mmHg |
70 – 100 |
|
Blood Glucose |
BG |
mg/dL |
75 – 150 |
|
Heart Rate Variability |
HRV |
ms |
~25 – 105 (Age dependent) |
|
Reflection Index |
RI |
% or 0–1 |
0.6 – 0.9 (60% – 90%) |
|
Arterial Stiffness Index |
LASI/SI |
m/s |
4 – 12 |
|
Stress |
Stress |
1–100 |
1 – 100 |
——————————————————————————–
 MEDICAL DISCLAIMER: This handbook is for educational purposes only. The information provided is based on software-based estimations and is intended to complement, not replace, the medical care chain. Only a qualified doctor can diagnose underlying causes or diseases. If you have health complaints, always seek professional medical care.
 English
  Español
  Italiano
  العربية
  Deutsch
  Русский